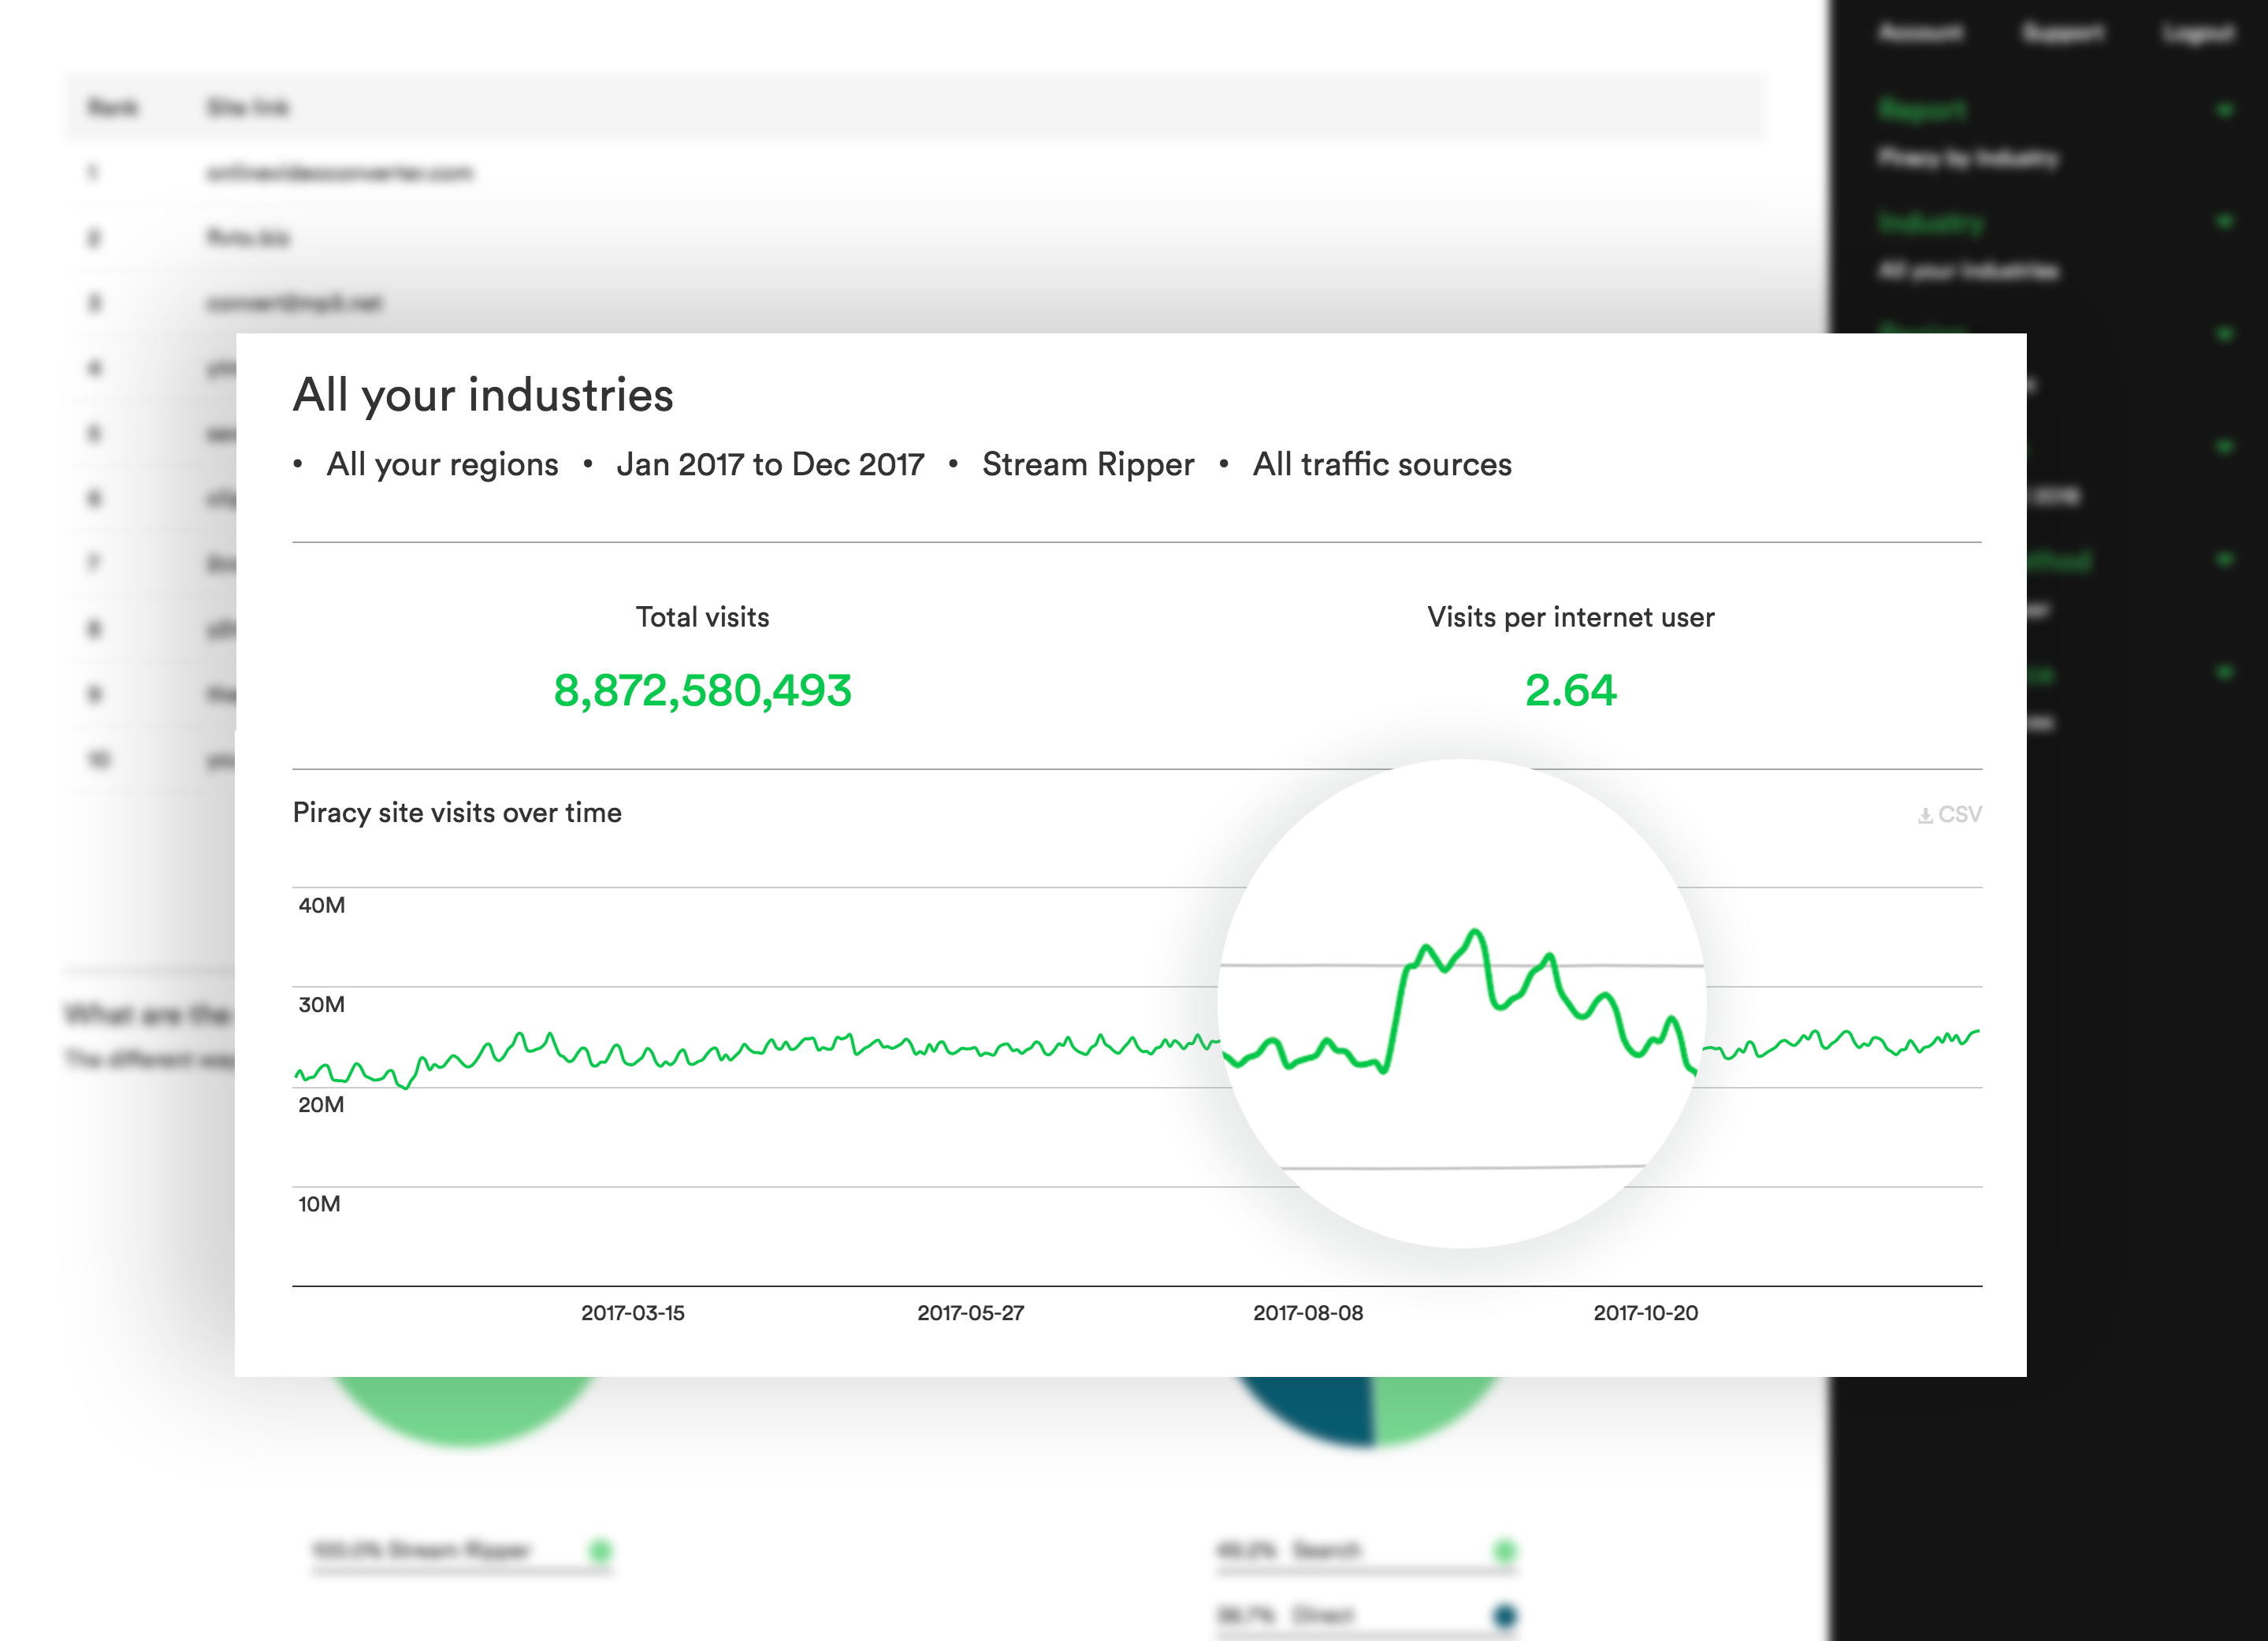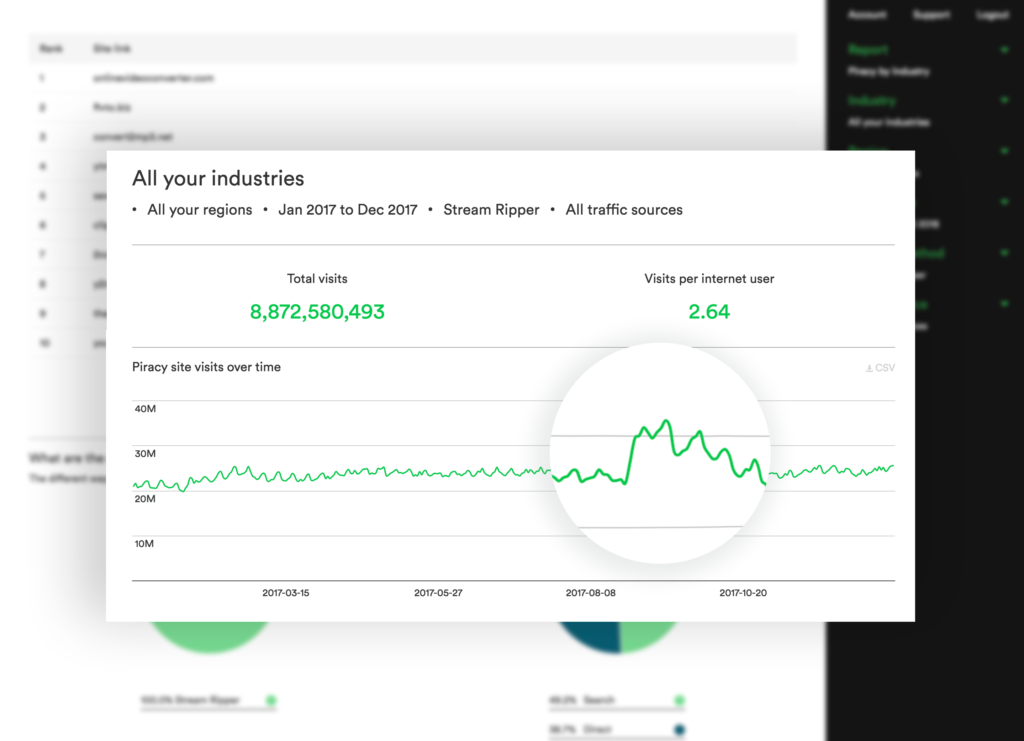
MUSO’s new ‘Piracy by Industry’ Dashboard allows for comparison of trends month-on-month. For example, when comparing June to July of 2018 we can see a 4.72 per cent increase in global piracy. However, what’s even more interesting is the ability to break down the data by industry, region, date and delivery method, and the new insight this reveals around the changes in behaviour of unlicensed audiences and the impact of anti-piracy strategies.
For example, through the Dashboard we are able to zero in on a particular piracy method called “stream ripping’, which allows streaming media content to be saved to a file so that it can be accessed locally.
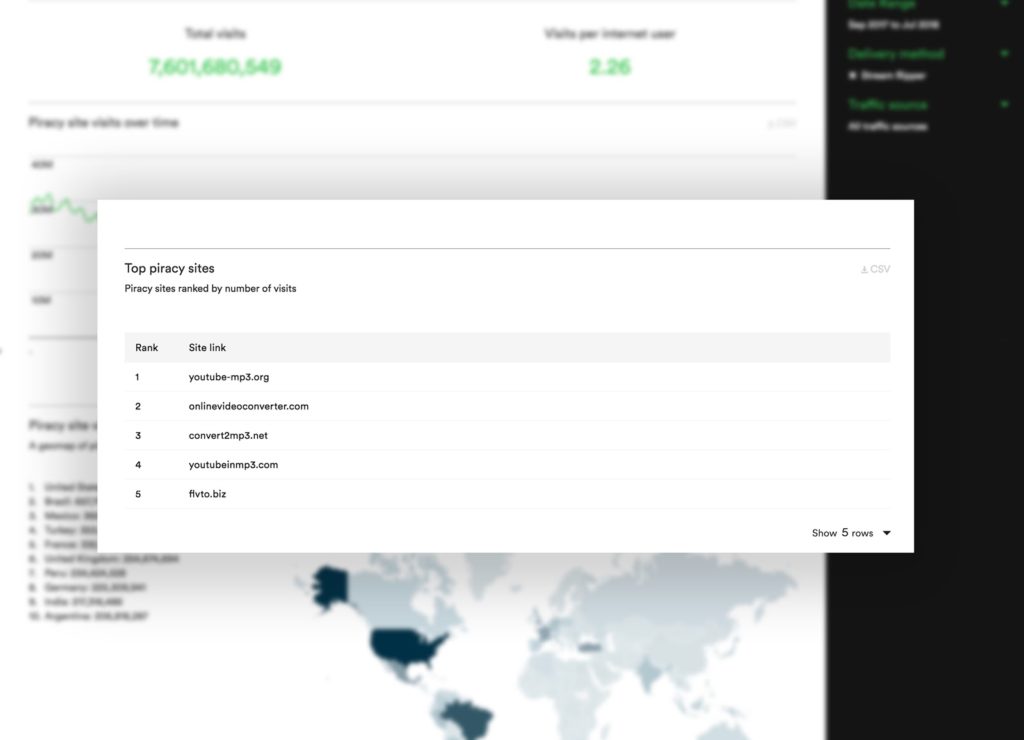
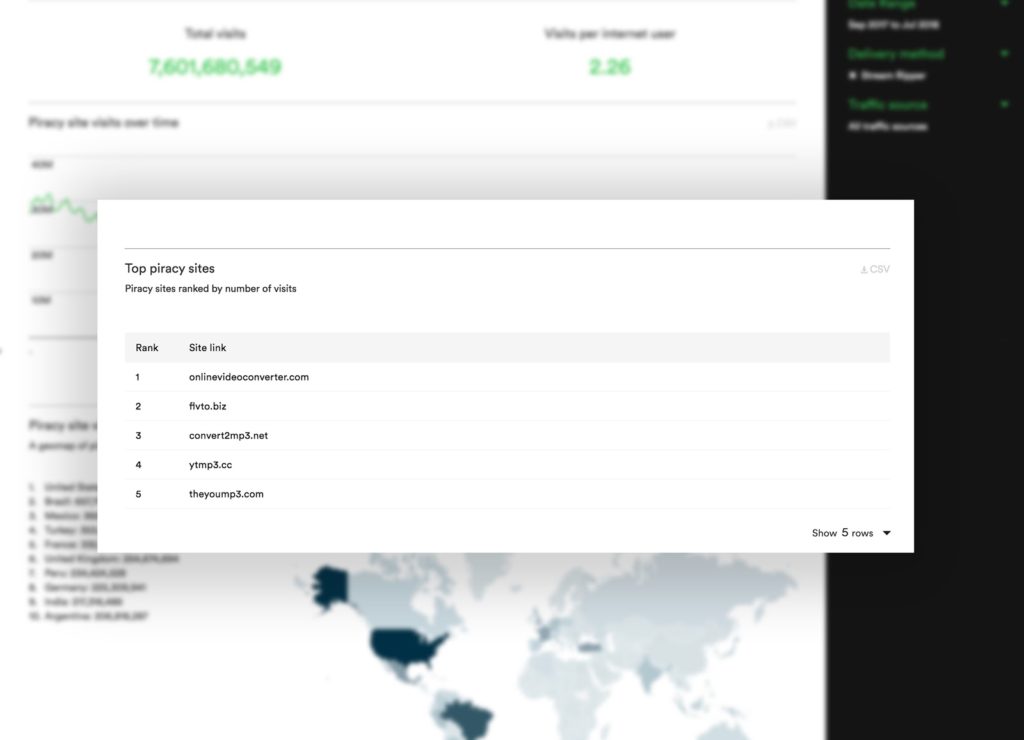
When we look at our piracy data , across all regions for content that was delivered via stream ripping in the first half of 2017, the top ranking site was youtube-mp3.org.

However, youtube-mp3.org closed down in September 2017 and our data shows that by the last quarter of 2017 it had been replaced by onlinevideoconverter.com as the most popular source for stream ripping.

MUSO’s view of piracy site visits over time also shows an interesting correlation in September, with a spike recorded as traffic moves around trying to find new sources of supply. This is a clearly visible shift in traffic toward alternative ripper domains as users test out different sites for the content they’re seeking. In fact, when comparing data for the months of August and September 2017, search traffic to stream ripper sites increased from 44.9 percent of all sources to 46.6 percent, as audiences actively sought out new domains and the relative share of stream ripping sites increased from 4.3 percent of all piracy visits to 5.1 percent of all piracy visits.

The swift nature in which habits can change in piracy consumption is further shown by the fact that there was a 9.42 percent jump in stream ripper traffic on 1st September 2017, when compared to just the day before – and throughout the whole of August the average daily change was just 1.36 percent.
For more insights like this please go to our Discover product page and contact us to arrange a demo.